How to Deploy Prometheus on Kubernetes with Rancher Desktop: A Step-by-Step Guide

Here’s a step-by-step tutorial for deploying Prometheus on Kubernetes using Rancher Desktop on macOS, with a focus on collecting Kubernetes metrics.
Prerequisites
- Rancher Desktop: Make sure Rancher Desktop is installed and configured to use Kubernetes.
- kubectl CLI: You need
kubectlinstalled and configured to interact with your Rancher Desktop cluster. - Helm CLI: You also need Helm installed, as we’ll use it to install Prometheus.
Set up Kubernetes in Rancher Desktop
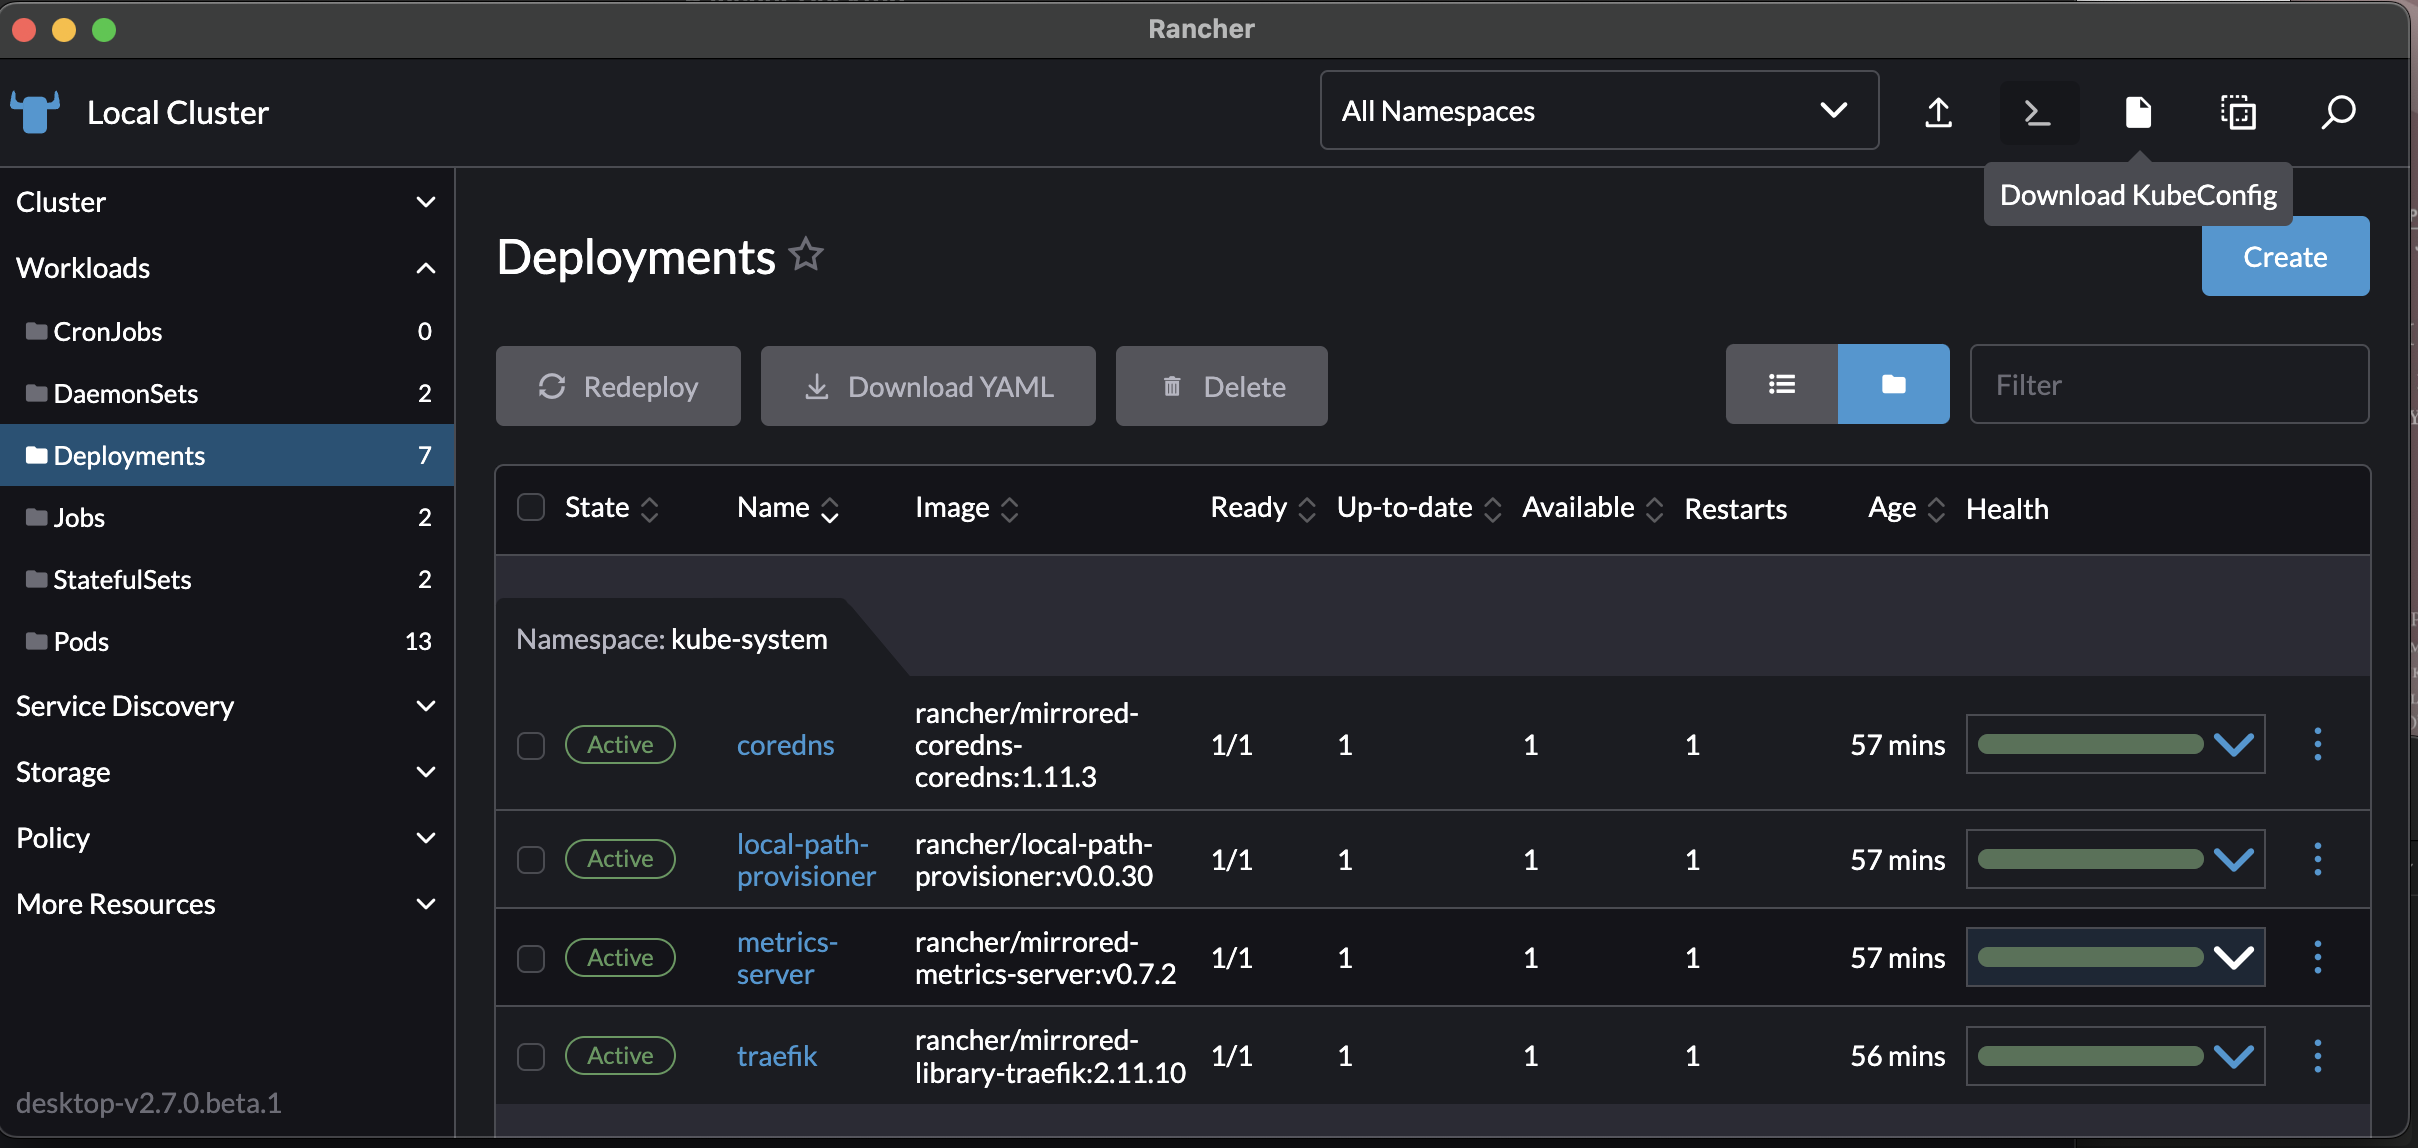
- Start Rancher Desktop and ensure Kubernetes is running.
- Verify Cluster Access by running:
You should see the nodes in your Rancher Desktop Kubernetes cluster.kubectl get nodes
Add the Prometheus Helm Repository
Prometheus can be installed easily using Helm, which allows you to customize configurations.
- Add the Prometheus community Helm chart repository:
helm repo add prometheus-community https://prometheus-community.github.io/helm-charts - Update your Helm repositories:
helm repo update
Install Prometheus Using Helm
To deploy Prometheus on your cluster, run the following Helm command. This installation will include both Prometheus and the necessary tools for scraping Kubernetes metrics, such as the kube-state-metrics and node-exporter.
helm install prometheus prometheus-community/kube-prometheus-stack --namespace monitoring --create-namespaceThis command does the following:
- Deploys the
kube-prometheus-stack, which includes Prometheus, Grafana, and other components for Kubernetes monitoring. - Creates a namespace called
monitoring(if it doesn’t exist).
Notes
- You can customize the installation by adding flags or by creating a custom values file (more on this in next step).
Customize Prometheus Configuration (Optional)
If you want to customize your Prometheus configuration, you can create a values.yaml file. Below is an example of common customizations, such as adjusting retention period or configuring Prometheus to scrape custom metrics.
-
Create a file named
values.yaml:prometheus: prometheusSpec: retention: 7d # Retain metrics for 7 days serviceMonitorSelector: {} # Scrape all ServiceMonitors in the namespace podMonitorSelector: {} # Scrape all PodMonitors in the namespace grafana: enabled: true adminPassword: 'admin' # Set a password for Grafana kube-state-metrics: enabled: true # Enable Kube State Metrics for Kubernetes data -
Install or upgrade the
kube-prometheus-stackwith your custom values:helm upgrade --install prometheus prometheus-community/kube-prometheus-stack --namespace monitoring -f values.yaml
This command applies the settings from values.yaml during the Helm deployment.
Verify the Prometheus Installation
-
Check the Status of Prometheus:
kubectl get pods -n monitoringYou should see multiple pods, including Prometheus, Grafana, and exporters like
kube-state-metricsandnode-exporter. -
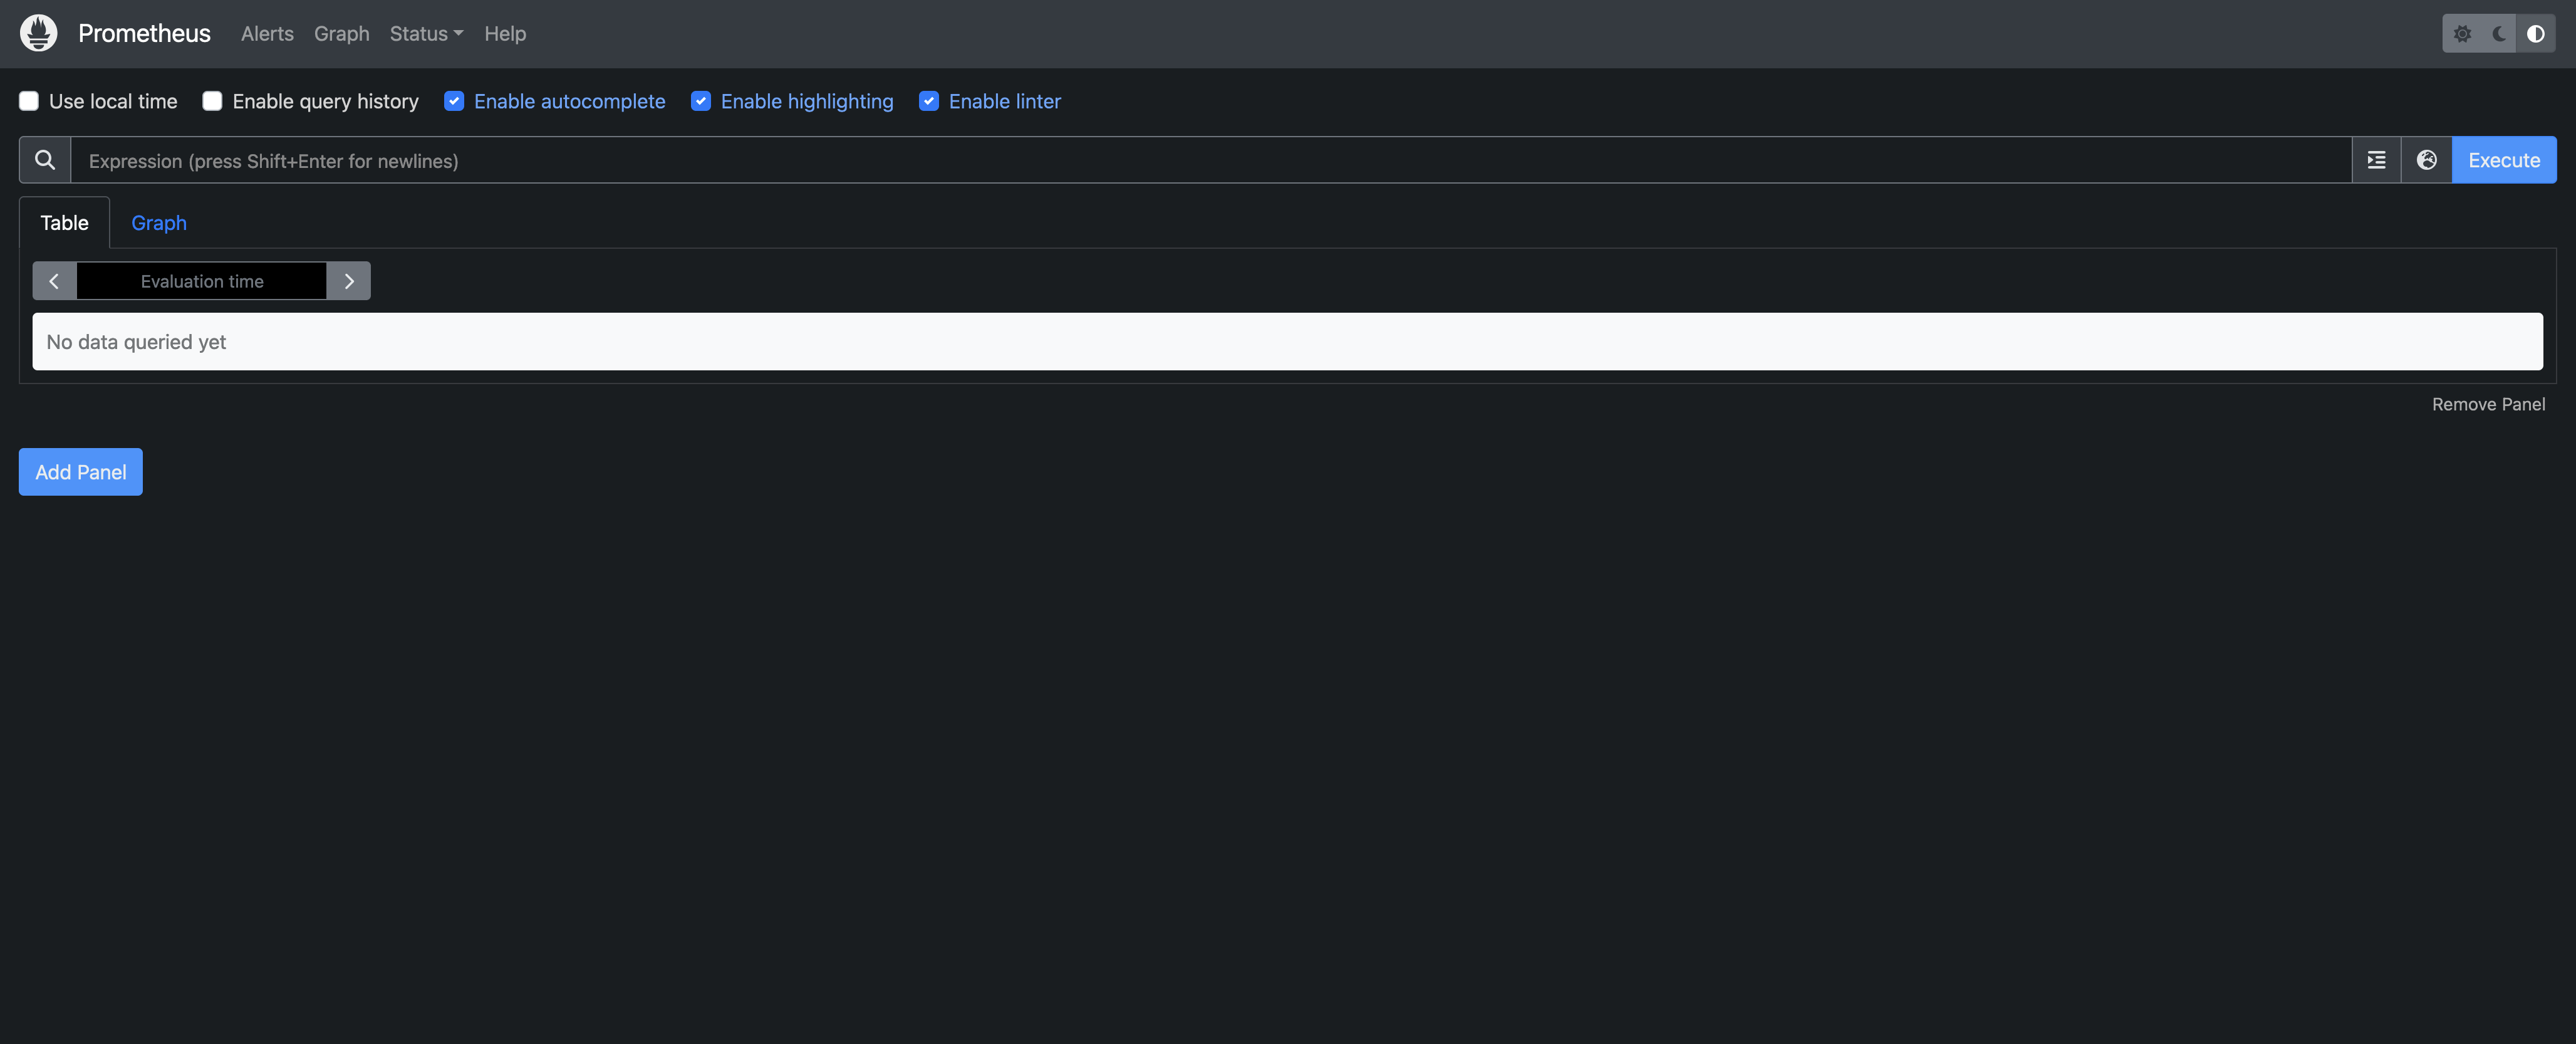
Access Prometheus Dashboard (Port-forwarding):
kubectl port-forward svc/prometheus-kube-prometheus-prometheus -n monitoring 9090:9090Now, visit http://localhost:9090 on your browser to access the Prometheus dashboard.
Set up Grafana to View Kubernetes Metrics (Optional)
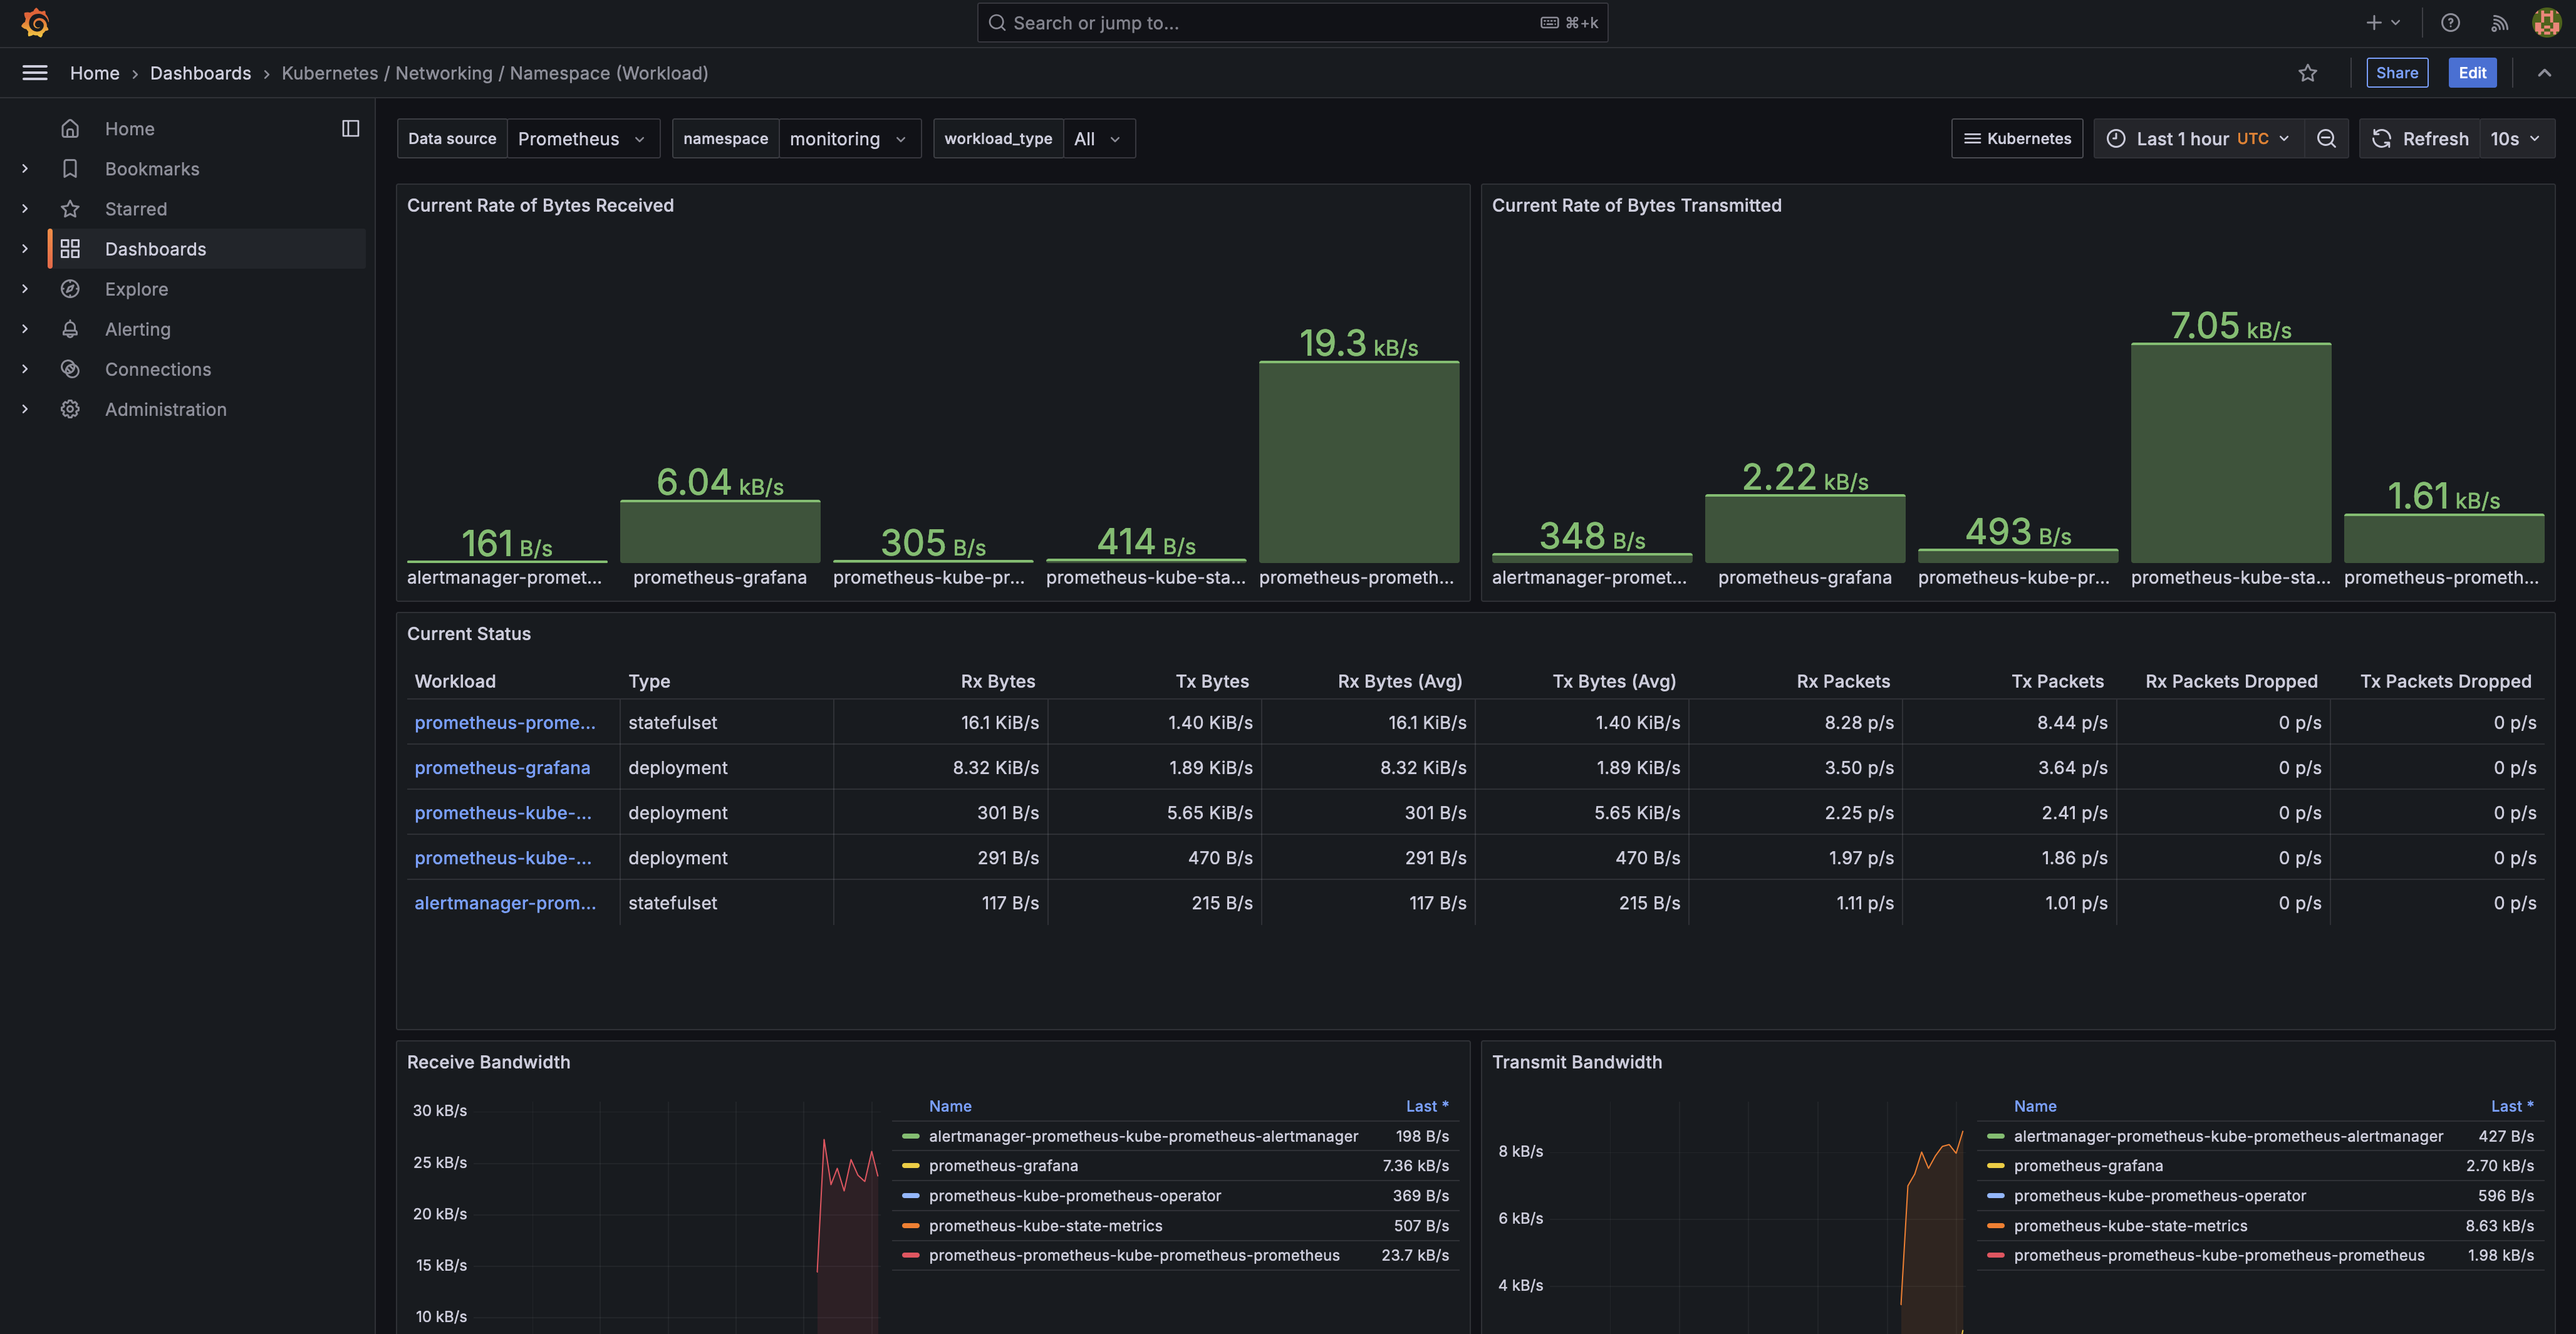
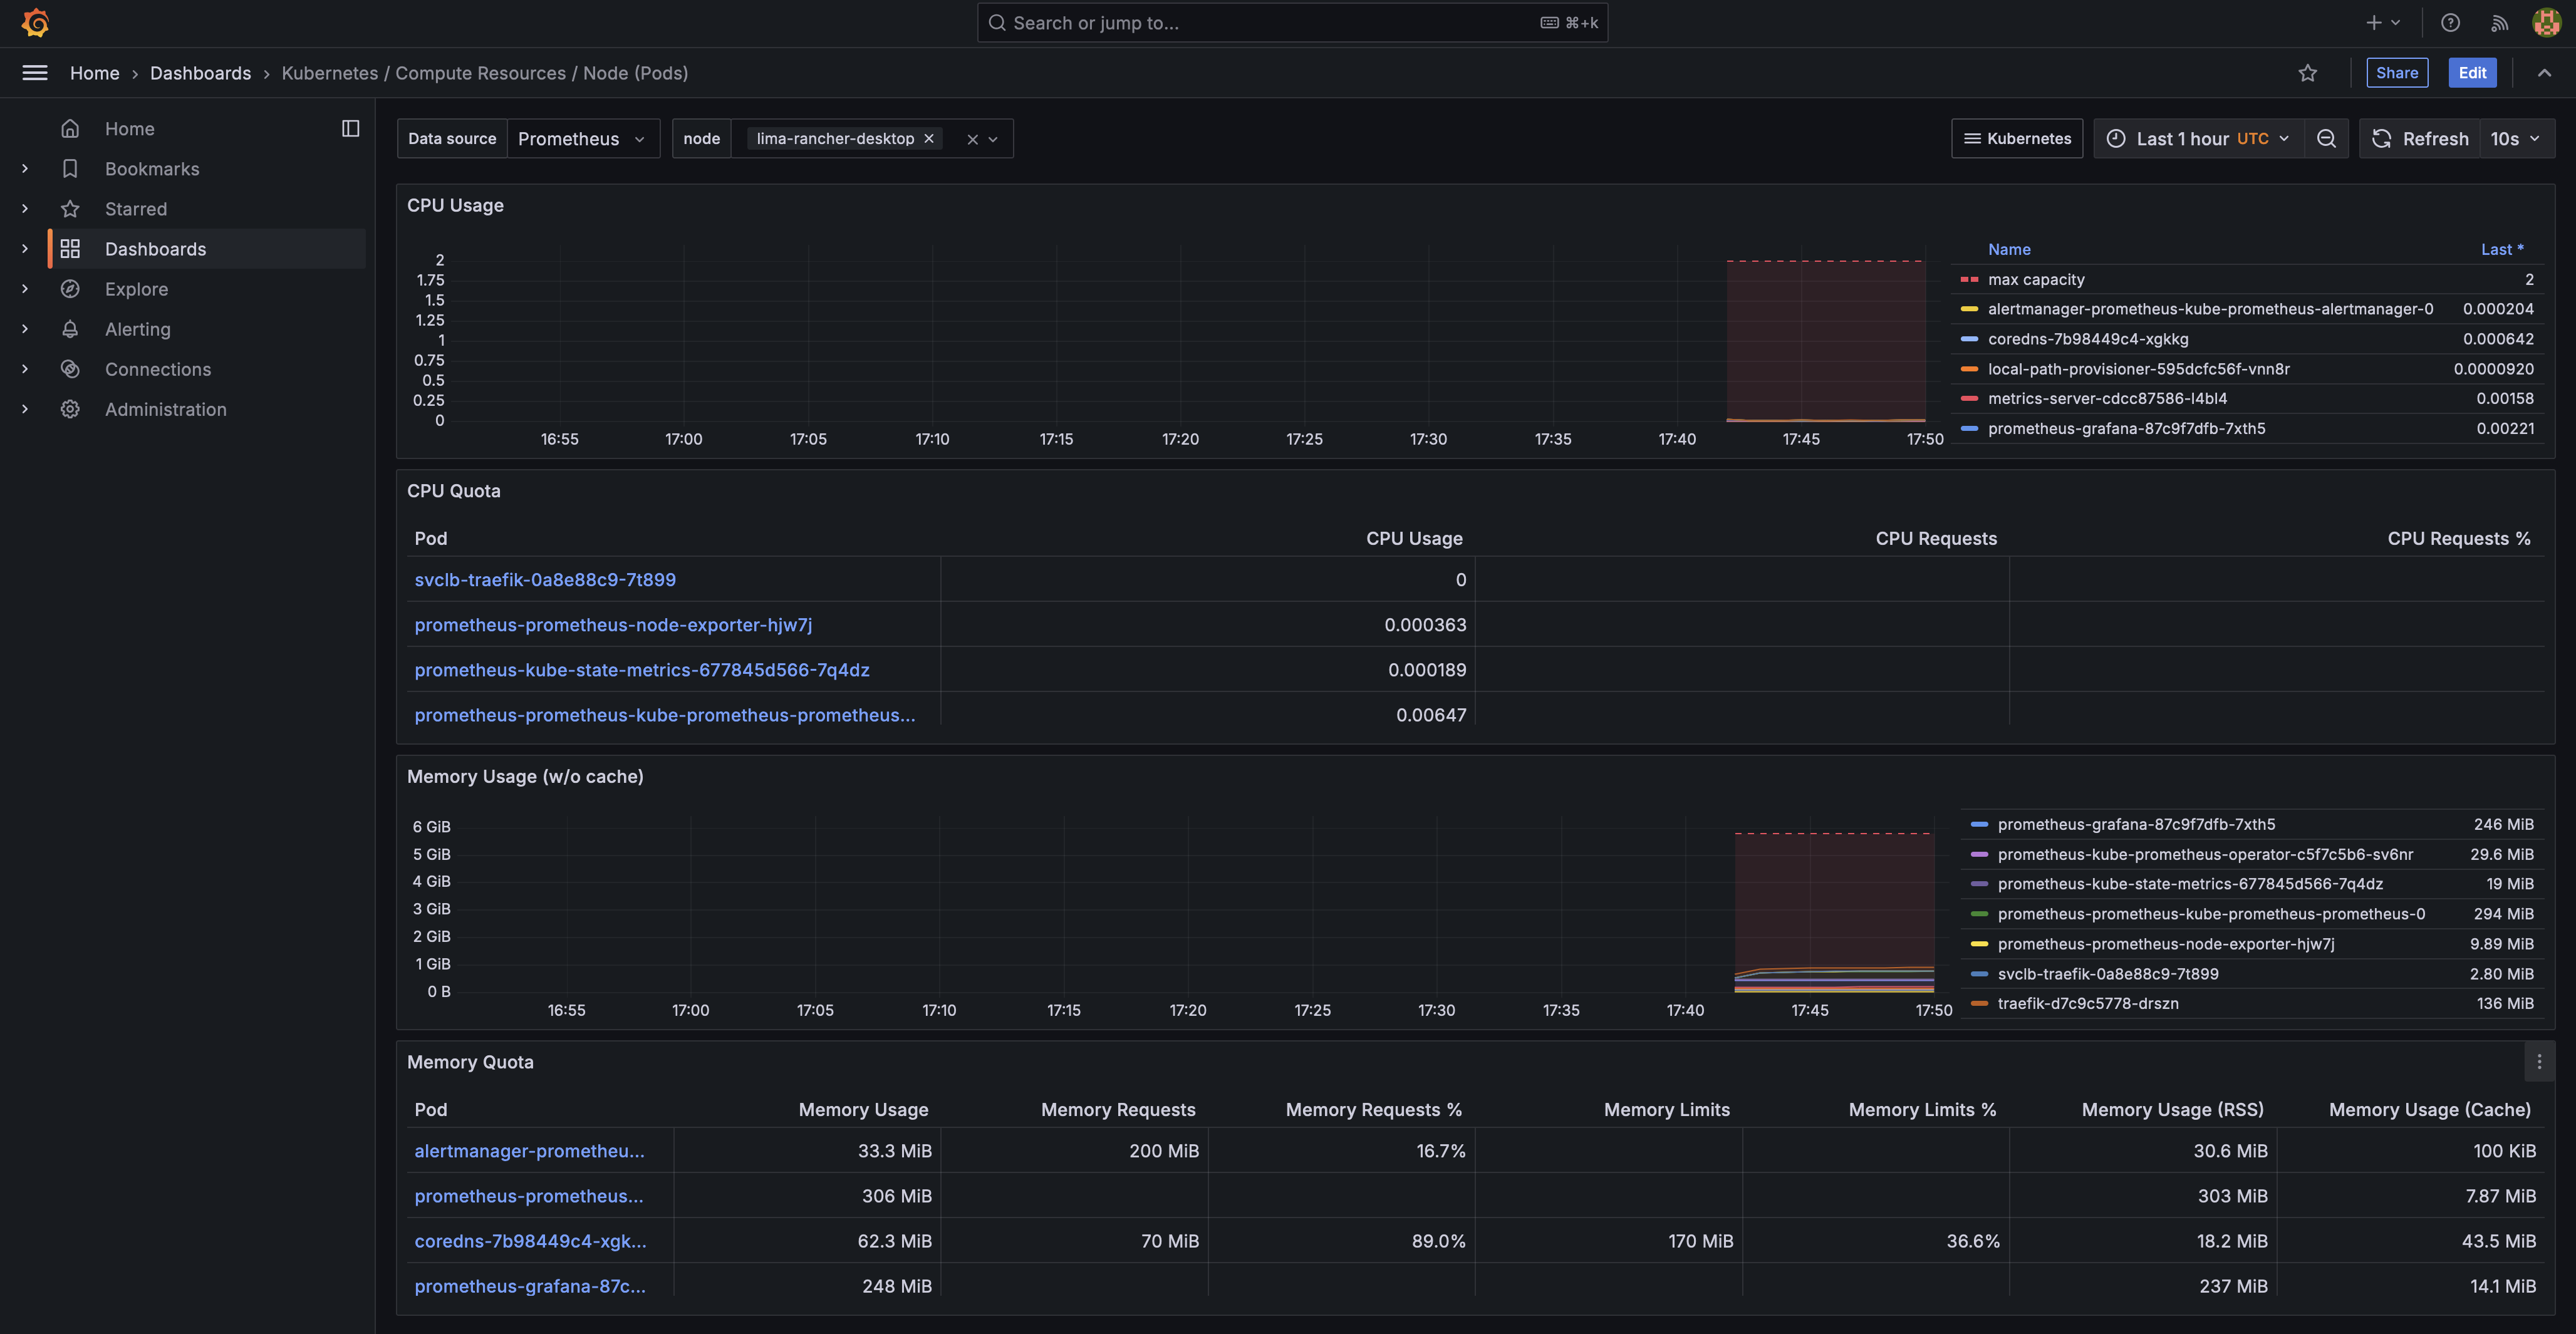
Grafana is included in the kube-prometheus-stack, making it easy to visualize the metrics collected by Prometheus.
-
Port-forward to access Grafana:
kubectl port-forward svc/prometheus-grafana -n monitoring 3000:80Access Grafana at http://localhost:3000.
-
Log in using the default credentials:
- Username:
admin - Password:
admin(or whatever you set invalues.yaml)
- Username:
-
Explore Dashboards:
- In Grafana, go to Dashboards > Manage. You should see several pre-configured dashboards for Kubernetes and Prometheus metrics.
Verify Prometheus is Collecting Kubernetes Metrics
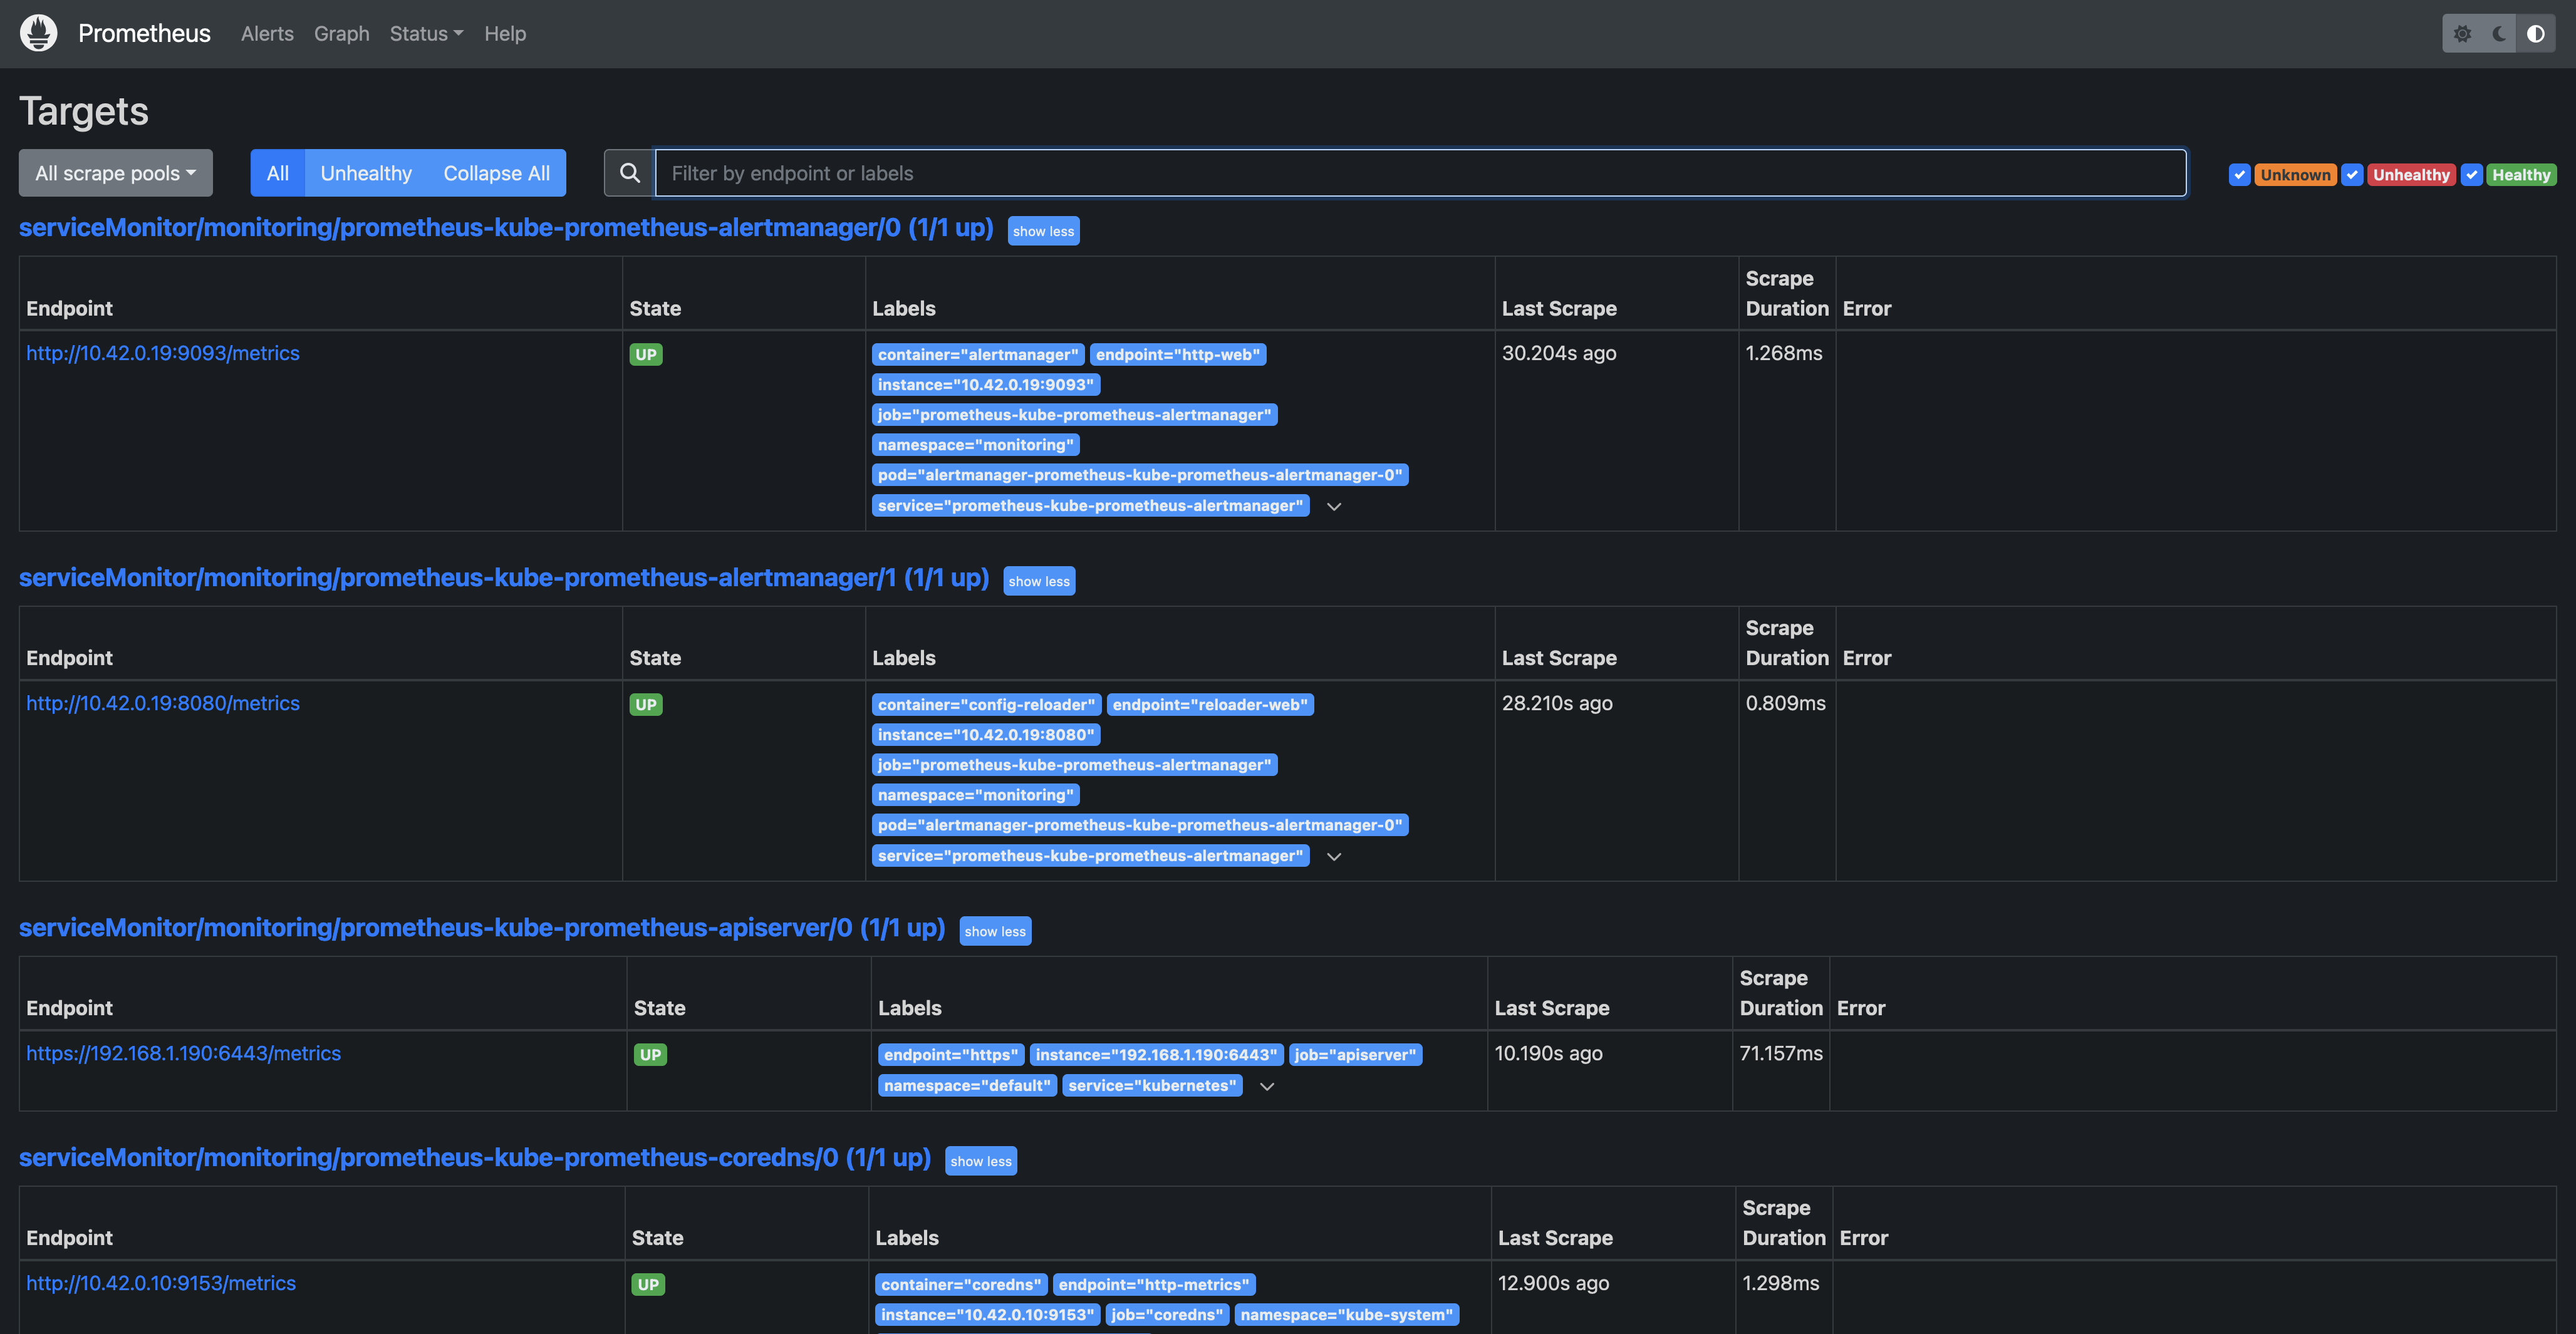
- In the Prometheus UI (accessed at
localhost:9090), go to Status > Targets. - You should see several targets, including:
kubeletendpoints (for node metrics)kube-state-metrics(for cluster state data)node-exporter(for node metrics)
Each target should show an UP status, indicating that Prometheus is successfully scraping metrics.
(Optional) Expose Prometheus and Grafana Services
If you want to access Prometheus or Grafana without using port-forwarding, you can expose these services with a LoadBalancer or Ingress.
Example with Ingress:
-
Apply an Ingress resource to expose the Grafana service:
apiVersion: networking.k8s.io/v1 kind: Ingress metadata: name: grafana-ingress namespace: monitoring spec: rules: - host: grafana.local http: paths: - path: / pathType: Prefix backend: service: name: prometheus-grafana port: number: 80 -
Update your
/etc/hostsfile to pointgrafana.localto your cluster’s IP or localhost, depending on your setup. -
Access Grafana at http://grafana.local.
Conclusion
You’ve successfully deployed Prometheus on Kubernetes using Rancher Desktop on macOS! This setup includes:
- Prometheus for collecting Kubernetes metrics.
- Grafana for visualizing metrics.
- Various exporters (like
node-exporterandkube-state-metrics) for enhanced monitoring.
